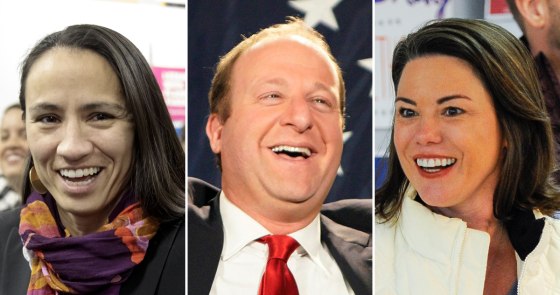
A record 432 openly LGBTQ candidates ran for federal, state and local office across the U.S. on Election Day, and more than half of them won their races, according to the LGBTQ Victory Fund.
The LGBTQ Victory Fund, which tracks, trains and promotes LGBTQ candidates, released a detailed report on Monday that outlined the contours of this growing segment of the body politic. The organization’s analysis found that 57 percent of all LGBTQ candidates won their elections. Of the 225 candidates endorsed by the LGBTQ Victory Fund, 72 percent emerged victorious.
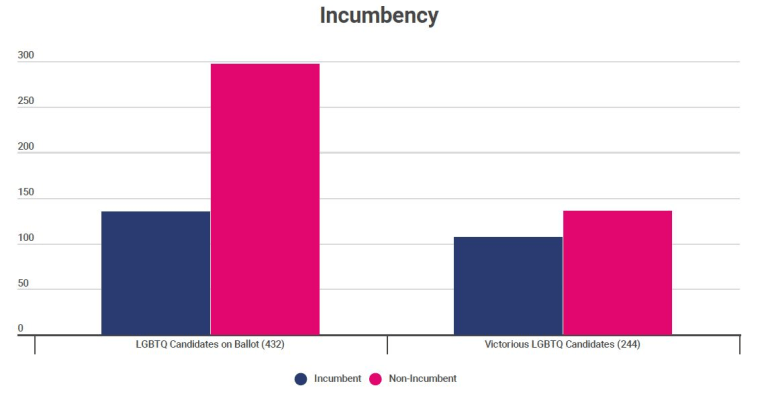
Incumbents comprised 135 of the 432 LGBTQ candidates on the ballot, according to the report, and the “incumbency advantage” played a role in their victories: 79 percent of LGBTQ incumbents won their race, compared to 46 percent of LGBTQ non-incumbents.
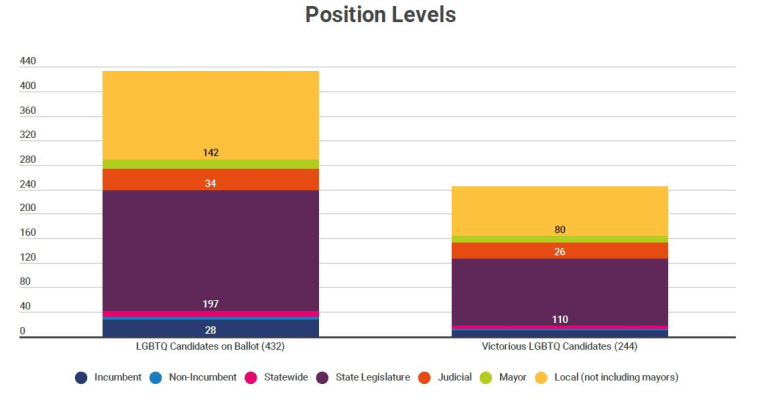
The toughest election arena for LGBTQ candidates was, by far, federal office — just 36 percent of all LGBTQ candidates who ran for federal office won. For all other offices, at least half of LGBTQ candidates won — governorships, statewide offices, judicial positions and municipal positions. But the number of LGBTQ elected officials in both the House and Senate will increase: Starting in January, there will be two openly LGBTQ members in the Senate, up from one, and eight in the House, up from six.
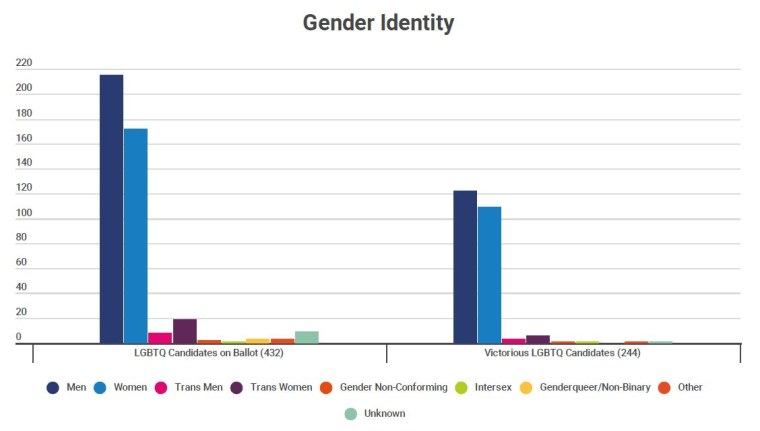
And, as was the case in many other elections across the country, female candidates outperformed male candidates. Nearly 57 percent of cisgender (non-transgender) men won, while more than 63 percent of cisgender women emerged victorious. For trans men and trans women, the rates were 38 and 32 percent, respectively.
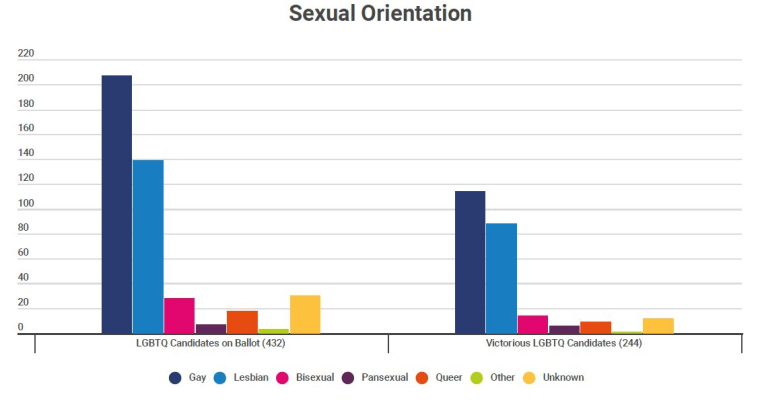
Gay men (48 percent) and lesbians (32 percent) made up the lion’s share of all LGBTQ candidates.
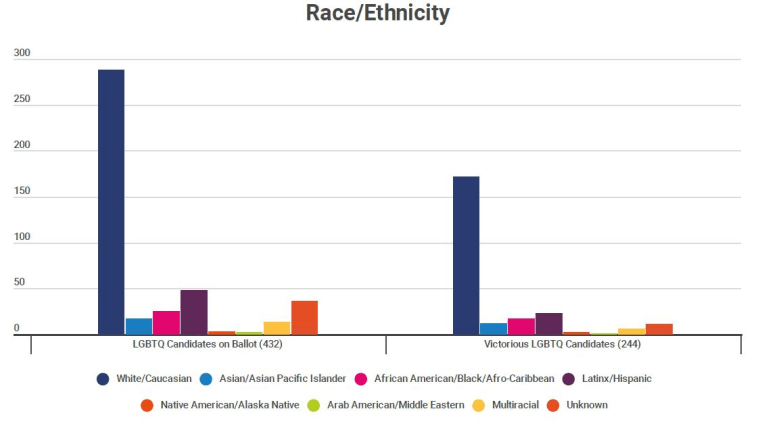
The 432 LGBTQ candidates were less diverse than the U.S. population as a whole but significantly more diverse than the country’s existing lawmakers. Nearly 67 percent were white, 11 were Latino, 6 percent were black and 4 percent were Asian or Pacific Islander. African-American and Asian-American candidates had the highest rate of success, 68 percent and 71 percent, respectively.
The area with perhaps the least candidate diversity was political affiliation. Just 5 percent of LGBTQ candidates ran as Republicans, while 86 percent ran as Democrats. Less than 2 percent ran as a third party candidates or as independents. Republican LGBTQ candidates fared poorly: just 17 percent won their races, compared to 61 percent of LGBTQ Democrats.
While the number of lesbian, gay, bisexual, transgender and queer elected officials across the U.S. will increase in January — once this year’s “rainbow wave” of candidates take office — LGBTQ people will still only make up about 0.1 percent of all elected officials, despite comprising an estimated 4.5 percent of the U.S. population.
“While the Rainbow Wave of LGBTQ candidates who ran this year was the most diverse ever, there is still a long way to go before equitable representation for our entire community is achieved,” Mayor Annise Parker, president and CEO of the LGBTQ Victory Fund, said of the report’s overall findings. “It is vital we recruit and train more LGBTQ people of color, women and trans candidates because America needs their voices in the halls of power.”
