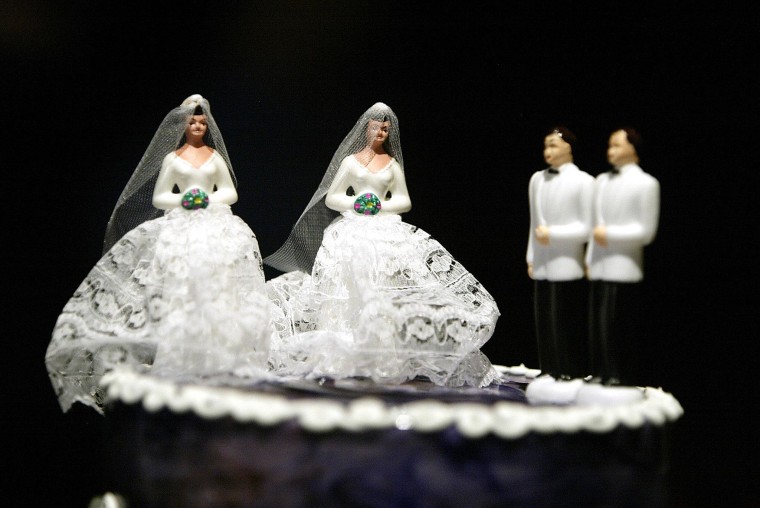
The percentage of Americans who support same-sex marriage has reached a record high, according to the latest NBC News/Wall Street Journal "Social Trends" poll.

Sixty percent of those polled say they support same-sex marriage, which is up from 59 percent in 2015 and 53 percent in 2013. Thirty-three percent say they oppose same-sex marriage, with the remaining respondents saying either it “depends” or they are “not sure.”
Among the groups that showed the highest percentage of support were Northeasterners, young adults, Democrats, non-religious people and those with postgraduate degrees.
The groups that showed the highest level of opposition include Trump supporters, religious people, those living in rural areas and people over 65.
Here is a breakdown of some of the polling data, showing individual groups and the percentage of people within those groups who say they favor same-sex marriage:
-
Party Affiliation
Democrats: 77%
Independents: 59%
Republicans: 42%
-
2016 Voters
Trump Voters: 37%
Clinton Voters: 79%
-
Gender
Men: 61%
Women: 59%
-
Age
18-34: 75%
35-49: 60%
50-64: 55%
65+: 42%
-
Ethnicity
White: 60%
Total Non-White: 60%
African-American: 51%
Hispanic: 66%
-
Religious Attendance
Weekly: 37%
Monthly: 59%
Yearly: 70%
Never: 80%
-
Region
Northeast: 70%
Midwest: 53%
South: 54%
West: 67%
-
Geography
Urban: 66%
Suburban: 61%
Rural: 47%
-
Education
High School or Less: 48%
Some College: 61%
College Graduates: 68%
Postgraduates: 72%
-

