In its recently concluded term, the U.S. Supreme Court handed down two big decisions affecting the decennial process of adjusting U.S. House districts to updated demographic data, with Chief Justice John Roberts writing for a 5-4 majority in both. In Ruccho v. Common Cause, the Court largely shut the door on any federal judicial interventions to limit partisan (as opposed to racial) gerrymandering, giving the mapmakers who are already making plans for what they’ll do once 2020 Census data is available a green light to exercise such powers as their own state laws and political dynamics make available. And in Department of Commerce v. New York, SCOTUS stopped the Trump administration from including a poorly justified citizenship question in the Census itself.
While the redistricting process is incredibly complex, and its trajectory will depend on election results in 2019 and in 2020, we now have some clarity in the congressional reapportionment part of the decennial adjustment, which is conducted by the House itself (which is required to notify the states by January 25 of the year following the Census of the number of seats they are “apportioned”). Yes, the president’s convoluted reaction to the Court’s decision on the Census held open the possibility of the federal government’s collecting citizenship data that states might theoretically use to change the basis of redistricting decisions (though there will be intense legal warfare if they do), but the administration has surrendered on the Census itself.
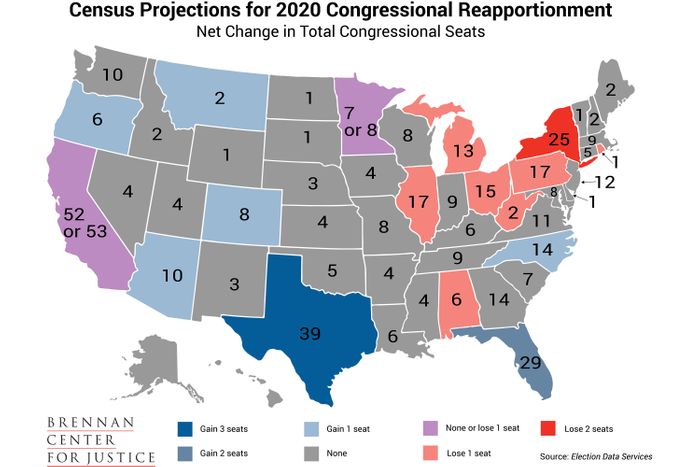
So we have a pretty clear idea of which states will be winners and losers in congressional reapportionment, based on Census estimates and projections. According to a late-December 2018 analysis from Election Data Services, Texas will pick up three House seats and Florida two; while Arizona, Colorado, Montana, North Carolina, and Oregon will gain one each. New York is projected to lose two seats, while Alabama, Illinois, Michigan, Ohio, Pennsylvania, Rhode Island, and West Virginia are expected to lose one. California and Minnesota are thought to be on the bubble for possibly losing one seat.
These shifts obviously reflect the long-term trend of shifts in population and political power from the Rust Belt to the Sun Belt, though the partisan implications aren’t quite that clear (five of the eight likeliest “loser” states were carried by Trump in 2016). Over time, some of these shifts have represented a sort of slow-motion demographic riot: The Electoral College map in place a half-century ago, prior to the very close 1960 election that produced President John Kennedy, gave New York 45 electoral votes (it will likely have 27 in 2024); Texas 24 electoral votes (41 in 2024); Pennsylvania 32 electoral votes (19 in 2024); California 32 electoral votes (52 or 53 in 2024); and Florida just 10 electoral votes (31 in 2024).
More immediately to the point, states gaining and losing House seats provide the easiest playgrounds for gerrymandering if they are under one-party control. At present, Republicans have total “trifecta” control of state governments in “winning” states Arizona, Florida, and Texas (though there is an independent redistricting commission in Arizona and there are restrictions on gerrymandering in Florida) and practical control in North Carolina (where the Democratic governor has no role in the process) and in “losing” states West Virginia and Alabama (where the Voting Rights Act even in its currently vitiated condition would likely prevent elimination of the state’s one Democratic House district). Democrats have a trifecta in “winners” Colorado and Oregon and “losers” Illinois and New York, though Colorado and New York have independent redistricting commissions. Some of these power balances could change next year.
It’s also worth remembering that populations (and for that matter, political alignments) don’t stop changing between the Census years, which can erode gerrymandering, as Reid Wilson noted recently after looking at trends in Texas:
“The GOP gerrymandering efforts rely on the most efficient distribution of GOP voters across as many districts as possible, the idea being to waste very few votes in each victory margin,” said Tom Bonier, a Democratic data analyst who runs the firm TargetSmart. “Combined with the population trends in many exurban areas, as they become more racially and ethnically diverse, the gerrymanders can become somewhat less effective the closer we get to the next decennial redistricting.”
Texas has grown at such a rapid pace that those careful calculations have been thrown out of whack. Where the average congressional district in the United States has grown by 23,200 people since the last Census, the average Texas district has grown by 74,000 people — and the average competitive Texas district, mostly centered around Houston, San Antonio, Austin and Dallas, has grown by an incredible 96,500 residents.
Texas Republicans publicly celebrate so many new residents, who come from states like California and New York in search of plentiful jobs and lower taxes. Privately, those Republicans bemoan the fact that the new residents still vote like they live in California or New York.
Post-Census shifts make it particularly important that gerrymanderers don’t overreach, since small margins of control in a large number of relatively competitive districts can backfire on the mapmakers owing to either population shifts or political trends, as Nathan Gonzales observes:
After they’ve earned the right to draw the maps by winning state elections, parties must balance the desire to maximize gains immediately with the reality that a map needs to withstand changes in the political environment over the course of a decade.
For example, in Pennsylvania, Republicans drew the map prior to the 2002 elections that elected 12 Republicans and seven Democrats. But the map took a hit mid-decade when Pennsylvania voters voiced their disapproval with President George W. Bush in the 2006 and 2008 elections by electing 12 Democrats and seven Republicans to the House. Republicans recovered in the 2010 elections to close out the decade with a delegation of 12 Republicans and seven Democrats again.
It’s all a tricky game on an ever-shifting landscape. So don’t expect to see maps that are fair or that truly determine future control of the House.


