WASHINGTON — The U.S. is getting grayer — but the changes are not uniform. And the variations across different geographies and demographic groups could have notable policy impacts in the coming years as the nation faces questions around program funding and cuts.
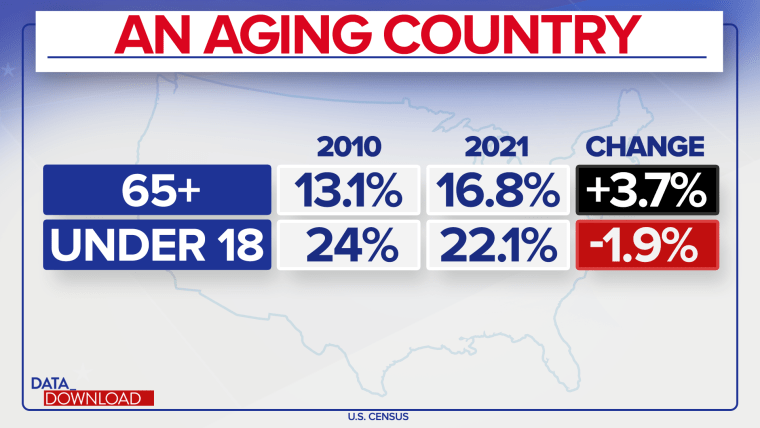
The census reveals that since 2010, the percentage of Americans ages 65 or older has climbed to nearly 1 in 6, spurred by the fact that the first member of the massive Baby Boomer generation crossed over that venerable age marker in 2011.
The rise in “seniors” is noteworthy as the percentage of American youths, the population under age 18, has fallen. The country just finished observing Older Americans Month in May — but the statistical reality of the aging population is ever-present.

In 2021, about 17% of Americans were in the 65-plus group. That was up almost 4 points from 2010, when about 13% of the nation’s population fell into it. On the other end of the spectrum, in the same period, the nation’s under-18 population fell by about 2 points, to roughly 22%, compared to 24% in 2010.
The figures are about more than percentages. Taken with the nation’s total population change over that time, they mean there were roughly 1 million fewer people under 18 in the U.S. in 2021 than there were in 2010. At the same time, the nation added about 1.5 million seniors.
The age composition of the country is about more than trivia or AARP subscriptions. The numbers have serious impacts on dollars-and-cents issues, from the size of the nation’s workforce to the number of people drawing off programs such as Social Security and Medicare. The graying of America has real policy meaning in Washington.
But not all regions or states are looking at the same kinds of challenges — and not at the same time.

Regionally speaking, Northeast states have the largest share of 65-or-older people: about 18% of the total population of Connecticut, Maine, Massachusetts, New Hampshire, New Jersey, New York, Pennsylvania, Rhode Island and Vermont. The Midwest, which stretches from Ohio to Kansas and north to the Canadian border, is next, at 17% of its population. The South, which covers Delaware all the way over to Texas, sits at 16.6%. And the West, which goes from Montana to New Mexico and into the Pacific, has the lowest proportion of older Americans, at not even 16%.
It should be noted that the share of the 65-plus population grew at roughly the same rate in that time in all of the regions — by 3.6 points to 4 points. But the higher numbers in the Northeast are likely to have a bigger impact on workforces and entitlement programs in that part of the country.
And differences in the population really stand out when you look at the state-level data.

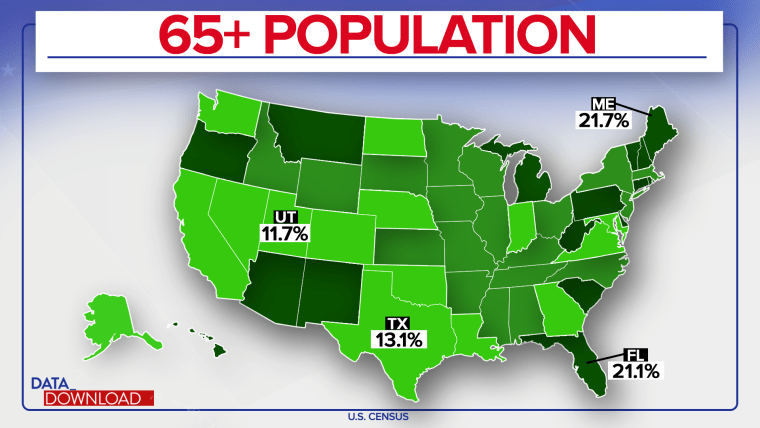
That Northeastern cluster of states jumps out of the map, including Maine, which has the largest share of 65-plus residents, at nearly 22%. Out West, the smaller 65-plus populations shares are evident in California, Colorado, Alaska and Utah, where not even 12% of the population is 65 or older.
The map also offers some clues about the different populations across the country. For instance, much of Utah’s smaller 65-plus population may be attributed to the state’s large Mormon population — those households tend to have more young children in them. Florida and Arizona, two states that attract retirees, are both on the higher end of the 65-plus scale.
And the map indirectly highlights a big part of the changing 65-plus landscape in the U.S. There are massive racial and ethnic differences in the numbers. Leading the way in the aging of America is the white, non-Hispanic population.

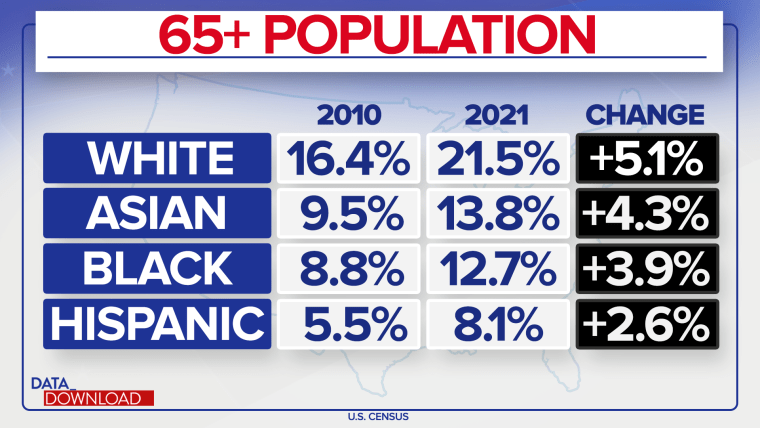
More than 1 in 5 white, non-Hispanic people living in the U.S. are older than 65. That is a remarkable number, and it has grown by more than 5 points since 2010. It is head and shoulders above the figures for the other major racial and ethnic groups in the country, a major sign of the changing nature of the U.S. population.
About 14% of the nation’s Asian population is 65-plus. The same is true for about 13% of the nation’s African American population. But the number for Hispanics is truly remarkable — only about 8% of that population, less than half the number for white, non-Hispanic U.S. residents.
Combine that data with the state and region numbers and they make sense broadly. After all, many of the states in the Southwest are home to large Hispanic populations, and New England is home to larger white, non-Hispanic populations, especially in upper New England.
The regional and racial or ethnic differences may raise other questions about the future in a time of shrinking resources. Students and seniors often want different things from their elected officials and their government, after all.
All of which is to say: Yes, the nation is graying, and it’s graying all over. But the bigger issue in the coming years may be how fast the graying is happening and where.